


Accurate, reproducible data ensures you get consistently meaningful assay results
Low coefficients of variation allow detection of changes in the abundance of specific proteins in a complex biological sample.
Scaling proteomics: SomaScan® Assay maintains precision from 5K to 7K to 11K protein measurements
The proteome reflects our biology and complex traits, changing over time in response to internal and external factors such as disease. With so many proteins in so many configurations working in networks that function in cohesive stability, it is necessary to look across the whole proteome in an unbiased approach to find changes that correlate with health outcomes.
This suggests that the value of information gained from proteomic studies is directly proportional to the number of proteins measured. However, increasing the range of proteins measured can directly affect the precision of measurement, challenging the accuracy of the data generated.
Expanding the coverage of proteomic profiling with SomaScan aptamer-based technology preserves precision, empowering more reproducible data and more meaningful insights with larger scale assays – a capability unmatched with other technologies.
Read these publications comparing high-plex protein profiling technologies, and concluding that the SomaScan Assay demonstrates the highest precision overall while maintaining this precision as the assay is scaled for increased content.
- Eldjarn, GH et al. Large-scale plasma proteomics comparisons through genetics and disease associations. Nature 622, 348–358 (2023)
- Rooney, MR et al. Plasma proteomic comparisons change as coverage expands for SomaLogic and Olink. medRxiv preprint 2024
With coefficients of variation ~5%, you can see even the smallest changes in disease state and therapy effectiveness
| Coefficient of Variation (CV) Values | |||||||
|---|---|---|---|---|---|---|---|
| SomaScan® 11K Assay | SomaScan® 7K Assay | ||||||
| Intra-Plate | Inter-Plate | Total | Intra-Plate | Inter-Plate | Total | ||
| Plasma | 3.3% | 3.0% | 4.5% | 3.6% | 3.8% | 5.3% | |
| Serum | 2.4% | 2.4% | 3.5% | 2.7% | 2.5% | 3.8% | |
With coefficients of variation ~5%, you can see even the smallest changes in disease state and therapy effectiveness
| SomaScan® 11K Assay Coefficient of Variation (CV) Values |
|||
|---|---|---|---|
| Intra-Plate | Inter-Plate | Total | |
| Plasma | 3.3% | 3.0% | 4.5% |
| Serum | 2.4% | 2.4% | 3.5% |
| SomaScan® 7K Assay Coefficient of Variation (CV) Values |
|||
|---|---|---|---|
| Intra-Plate | Inter-Plate | Total | |
| Plasma | 3.6% | 3.8% | 5.3% |
| Serum | 2.7% | 2.5% | 3.8% |

Curated CV research publications
- Analytical and Biological Variability of a Commercial Modified Aptamer Assay in Plasma Samples of Patients with Chronic Kidney Disease
- Assessment of variability in the plasma 7k SomaScan proteomics assay
- Reproducibility and Variability of Protein Analytes Measured Using a Multiplexed Modified Aptamer Assay
Leading the industry with dependably low CVs
No other proteomic platform consistently provides median CVs as low as the SomaScan Platform.
We created the SomaScan Platform with a median CV of ~5%, which means researchers can use the fewest number of samples to detect the most minute biological changes. Without this level of precision, we believe these changes cannot be reliably tested in individuals, and clinical studies will require many more participants.
Currently, researchers using other assays see CVs ranging from:
• 5-20% with proximity ligation assays that use polyclonal antibodies
• 10-20% with mass spectrometry
What is the benefit of CVs ~5%?
Median CVs ~5% yield an unmatched level of precision that allows researchers to reliably perform analysis and clinical studies with fewer participants than is required with other proteomic platforms.
Relative to the SomaScan Assay with a ~5% CV, a platform with CVs of about 10% would need approximately 2,300 more samples to detect a 1% difference in means compared to detecting that difference using the SomaScan Assay.
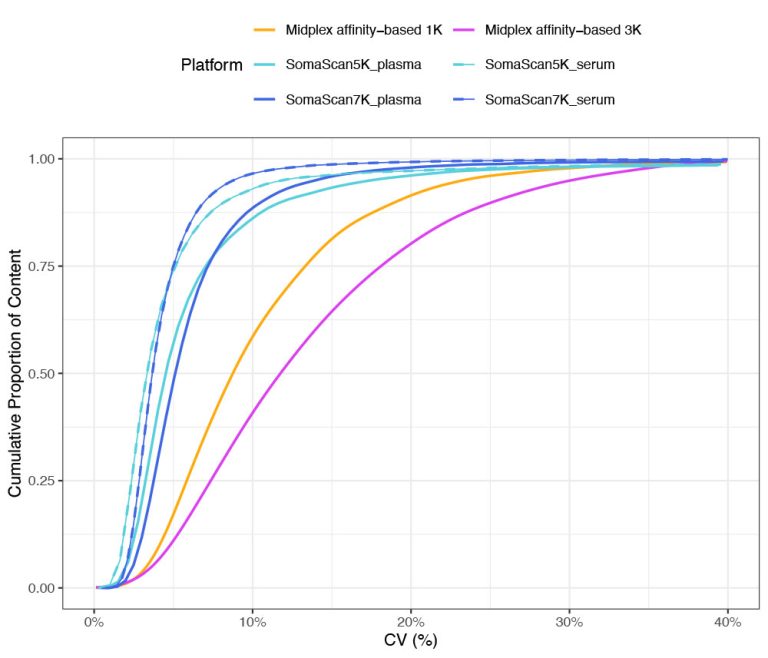
Midplex affinity-based
platforms show median CVs
close to 9% and 12%
The CDF plots reinforce not only the stability of the SomaScan Assay, but also illustrate how the low CVs distinguish the platform from other proteomic technologies.
What is the benefit of CVs ~5%?
Median CVs ~5% yield an unmatched level of precision that allows researchers to reliably perform analysis and clinical studies with fewer participants than is required with other proteomic platforms.
Relative to the SomaScan Assay with a ~5% CV, a platform with CVs of about 10% would need approximately 2,300 more samples to detect a 1% difference in means compared to detecting that difference using the SomaScan Assay.
Midplex affinity-based
platforms show median CVs
close to 9% and 12%
The CDF plots reinforce not only the stability of the SomaScan Assay, but also illustrate how the low CVs distinguish the platform from other proteomic technologies.

Optimizing biomarker discovery with focus on low coefficient of variation in large-scale proteomics
When it comes to biomarker discovery, higher technical variability – which results from higher CVs – means more samples are required to detect a statistically significant difference. Such assay noise can also limit measurements or discoveries, which can mean a loss in detectability or an obstruction of biological effect sizes.