SomaScan
Data Consulting
Services
Turn complex proteomic data into actionable insights
Maximize the value of your proteomic data with expert support
Proteomics offers unparalleled biological insights, yet many researchers face challenges in data analysis, interpretation and integration. The SomaScan™ Assay enables 11,000 protein measurements, but making sense of complex datasets can be challenging. Our fee-for-service Data Consulting Services eliminate these barriers, helping you navigate large datasets, extract meaningful insights and accelerate biomarker discovery, without the burden of bioinformatics challenges.
Led by expert bioinformaticians, we offer tailored solutions for every stage of research, from study design and quality control to biomarker discovery, pathway analysis and data interpretation.
Contact us to gain insight into your data
Comprehensive bioinformatics and data analysis
support for SomaScan Assay data
Our expert-driven services include:
Why choose our bioinformatics experts?
Our structured approach to proteomic data consulting has empowered researchers with clear study design guidance, pre-analytical quality control and advanced statistical recommendations. From ensuring seamless data integration to providing comprehensive reports, our bioinformaticians help researchers navigate challenges with confidence. With dedicated support and rapid responsiveness, we enable more efficient, high-impact data analysis.
Bioinformatics expertise with SomaScan data
- Leverage insights from expert bioinformaticians specializing in SomaScan Assay data
- Ensure high-quality, reproducible proteomic analysis results
Customized data analysis for your research goals
- Work with our bioinformatics experts to define and execute the right data analysis approach
- Receive customized strategies for small-scale experiments to large clinical research studies
Accelerate discoveries without constraints
- Overcome expertise or resource gaps with simplified, expert-driven proteomic data analysis
- Expand research capabilities with scalable proteomic data analysis solutions
See the data: Visualization examples for SomaScan Assay analysis
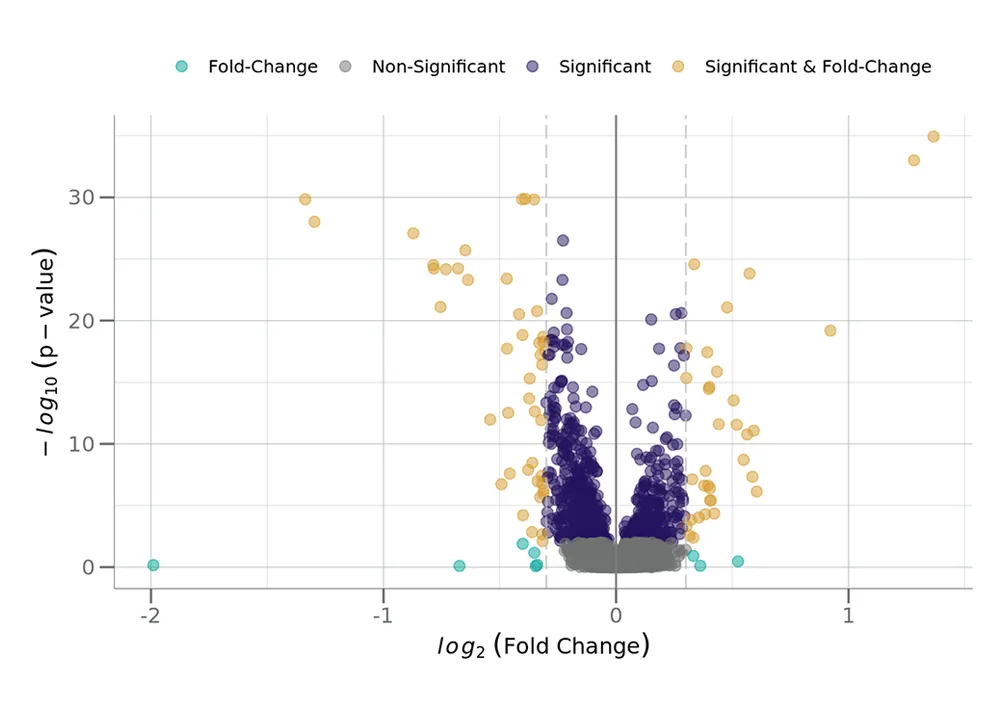
Volcano plots
A volcano plot compares the p-value versus effect size (fold change). It enables quick visual identification of key biomarkers that have large fold change and exceed the significance threshold.
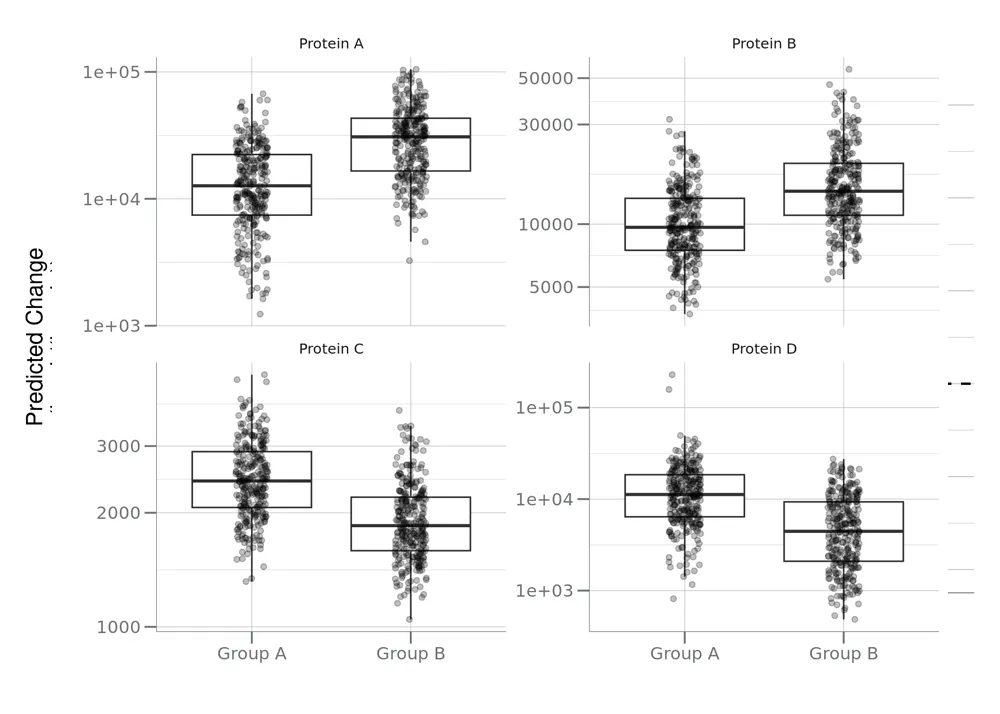
Box plots of top biomarkers
A box plot allows you to dig deeper into the top biomarkers identified in the statistical analysis by plotting the RFU signals directly or evaluating against other covariates in your study.
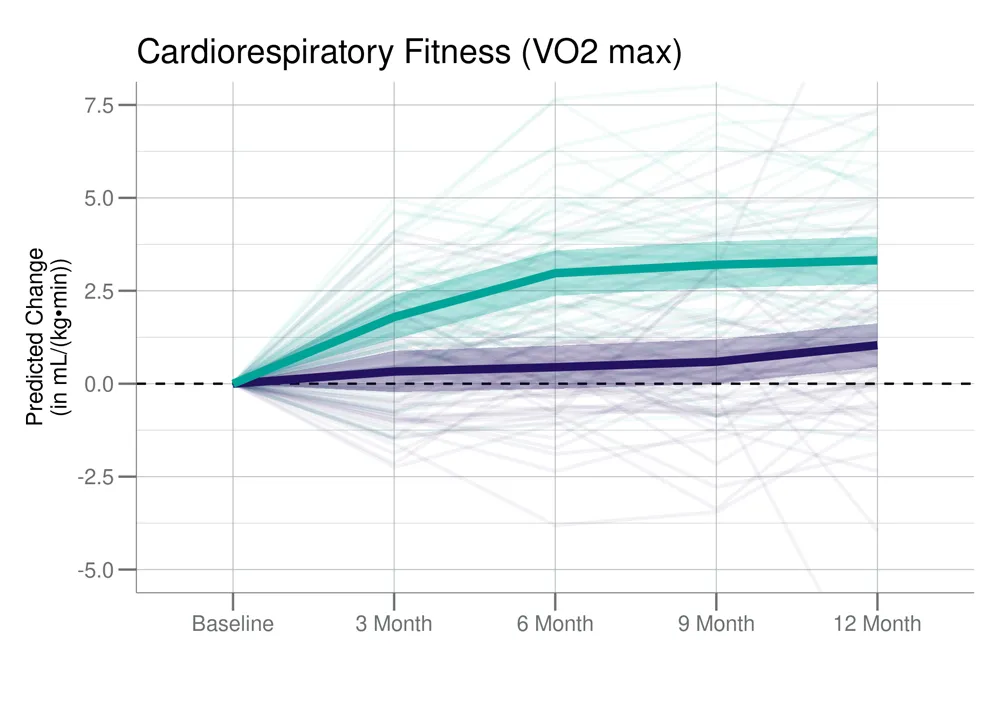
Trendline plots
A trendline plot shows the flow of changes in a measurement or group of measurements against the background of all measurements. This can highlight how a set of proteins changes over time.
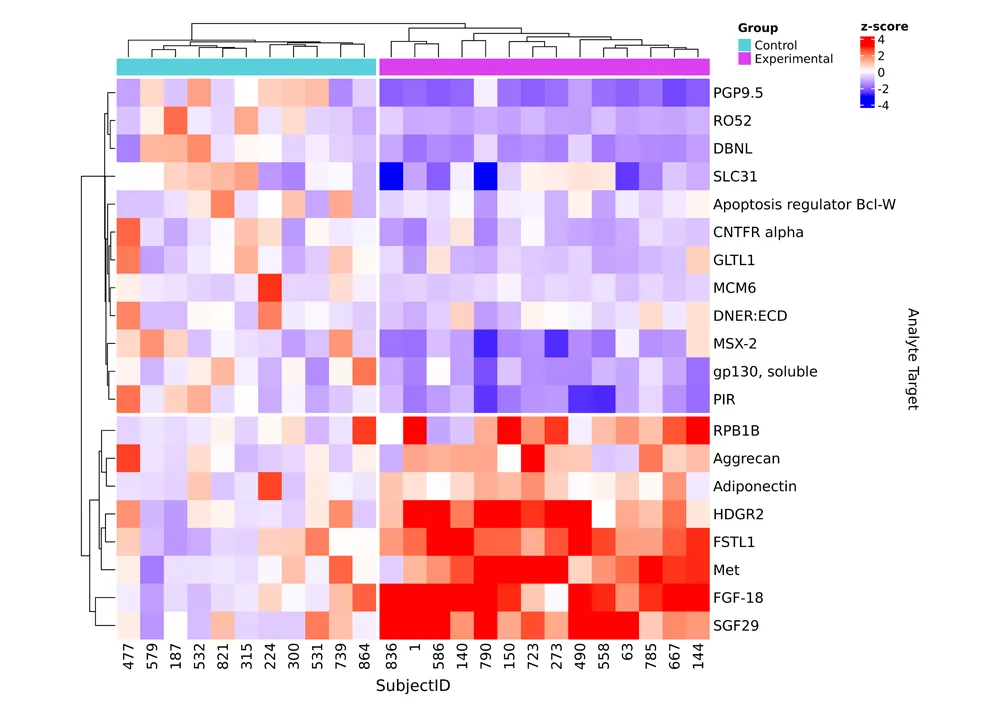
Heat maps
A heat map aids in visualizing expression patterns across samples, highlighting variations in protein abundance. It can help identify clusters of proteins or samples with similar profiles, making it easier to spot trends, biomarkers or treatment effects.
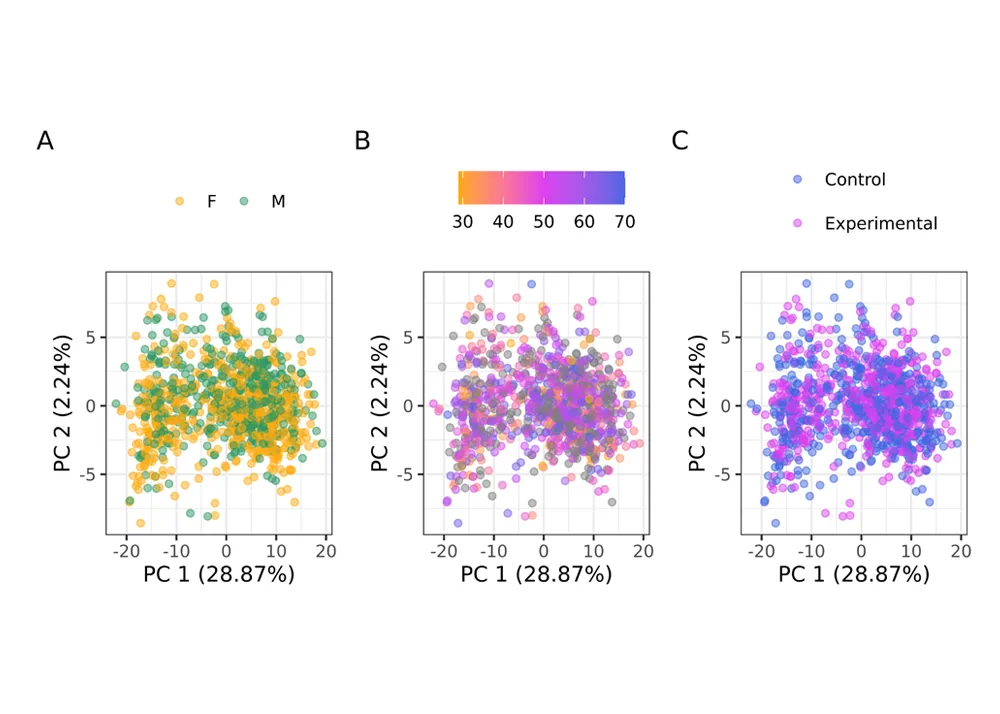
Principal component analysis (PCA) plots
A PCA plot identifies patterns, clusters and outliers while also aiding in feature selection and noise reduction. In proteomic studies, a PCA plot can highlight differences between sample groups, such as treatment vs. control, in a clear and interpretable way.
Downloadable resources
Standardizing the
SomaScan Assay data
From normalization to QC checks, the SomaScan Assay reduces technical variation to support reproducible proteomic insights.

Take your proteomics
data further
Learn how to get more from your proteomics data with our bioinformatics experts in the on-demand SomaScan Data Summit.
Maximize the impact of your SomaScan Assay results
Let our bioinformatics experts help you transform
complex proteomic data into actionable insights.


