


Key Challenges in Plasma Proteomics for Biomarker Discovery Research
If plasma is such a rich source of biological information, why isn’t it easier to find new biomarkers? The answer lies in the extreme complexity of the plasma proteome and the vast range of protein concentrations it contains.
Complexity and dynamic range of the plasma proteome
Although plasma contains thousands of proteins, just 20 account for 99% of its total protein mass, with albumin alone making up more than half (Figure 1)1-3. At the same time, protein concentrations span more than 10 orders of magnitude.
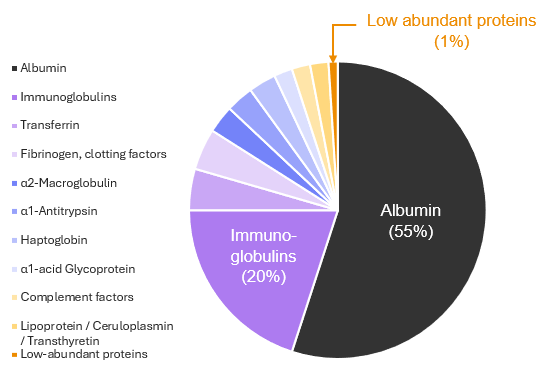
This imbalance means that biologically important proteins can be masked by a small number of highly abundant ones during biomarker discovery, making comprehensive measurement difficult even with advanced analytical methods1,2.
Figure 1. Composition of the plasma proteome. Figure adapted from Jaros et al.3.
Why low-abundance proteins matter
Protein biomarkers that reflect disease states are often present at very low levels in the blood. For instance, more than 90% of the protein biomarkers approved by the U.S. Food and Drug Administration (FDA) fall within the lowest 1% of the total protein mass of the plasma proteome, shown as the dark orange slice in Figure 14.
Despite their low abundance, these proteins are highly informative. They support early diagnosis, risk stratification and therapeutic monitoring. They also provide insight into disease mechanisms and help guide drug development.
Strategies for detecting low-abundance proteins
Plasma’s wide dynamic range of protein concentrations presents a significant challenge for comprehensive protein detection and quantification. In an unprocessed (“neat”) plasma sample, mass spectrometry typically detects only 300–1,000 proteins – primarily those that are present at higher concentrations (Figure 2A)1,2,5,6. As a result, many clinically relevant low-abundance proteins are missed.
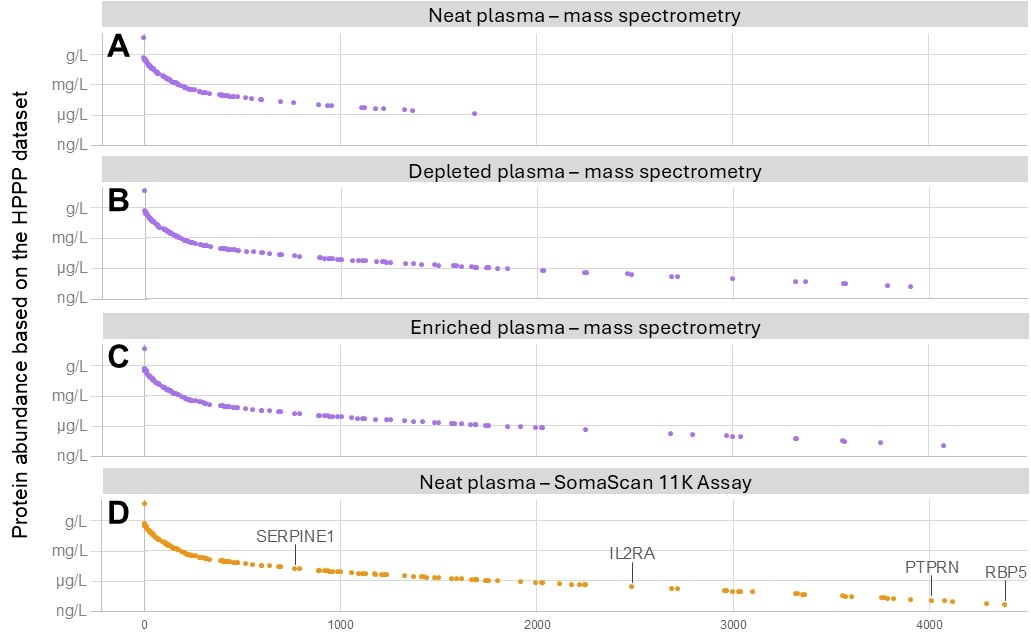
Figure 2. Proteins in plasma measured by mass spectrometry or affinity-based proteomics. Proteins detected using mass spectrometry (purple) include those measured in: A) neat plasma, B) plasma with the top 14 most abundant proteins depleted, and C) enriched plasma. D) Proteins in neat plasma measured using an affinity-based proteomics platform, the SomaScan™ 11K Assay (orange). Only proteins that overlap with the Human Plasma Proteome Project (HPPP) dataset are shown4. Of the 4,425 proteins with concentrations reported in the HPPP dataset, 4,285 were measured using mass spectrometry. Data for panel A adapted from Beimers et al5. Data for panels B–D adapted from Kirsher et al.7.
To go deeper, researchers use strategies such as depleting high-abundance proteins, fractionating the sample or enriching for lower-abundance targets (Figures 2B-C). While these approaches can expand coverage to thousands of proteins, they also introduce trade-offs in experimental complexity, time, cost and reproducibility1,7.
To help bridge this gap, highly multiplexed affinity-based platforms that use selective binding reagents have emerged as a powerful complement to mass spectrometry1. These technologies offer targeted, high-throughput assays that can measure panels of plasma proteins without the need to deplete, fractionate or enrich plasma, making them particularly attractive for large-scale studies (Figure 2D).
Importantly, these two approaches serve distinct but complementary roles:
- Affinity-based platforms excel at the reproducible detection of thousands of plasma proteins across a wide dynamic range.
- Mass spectrometry remains essential for characterizing post-translational modifications, isoforms and sequence variants that often provide mechanistic insight into disease processes7.
By leveraging the strengths of both technologies, researchers are gaining a more complete view of the plasma proteome and its role in health and disease (Figure 3)8.
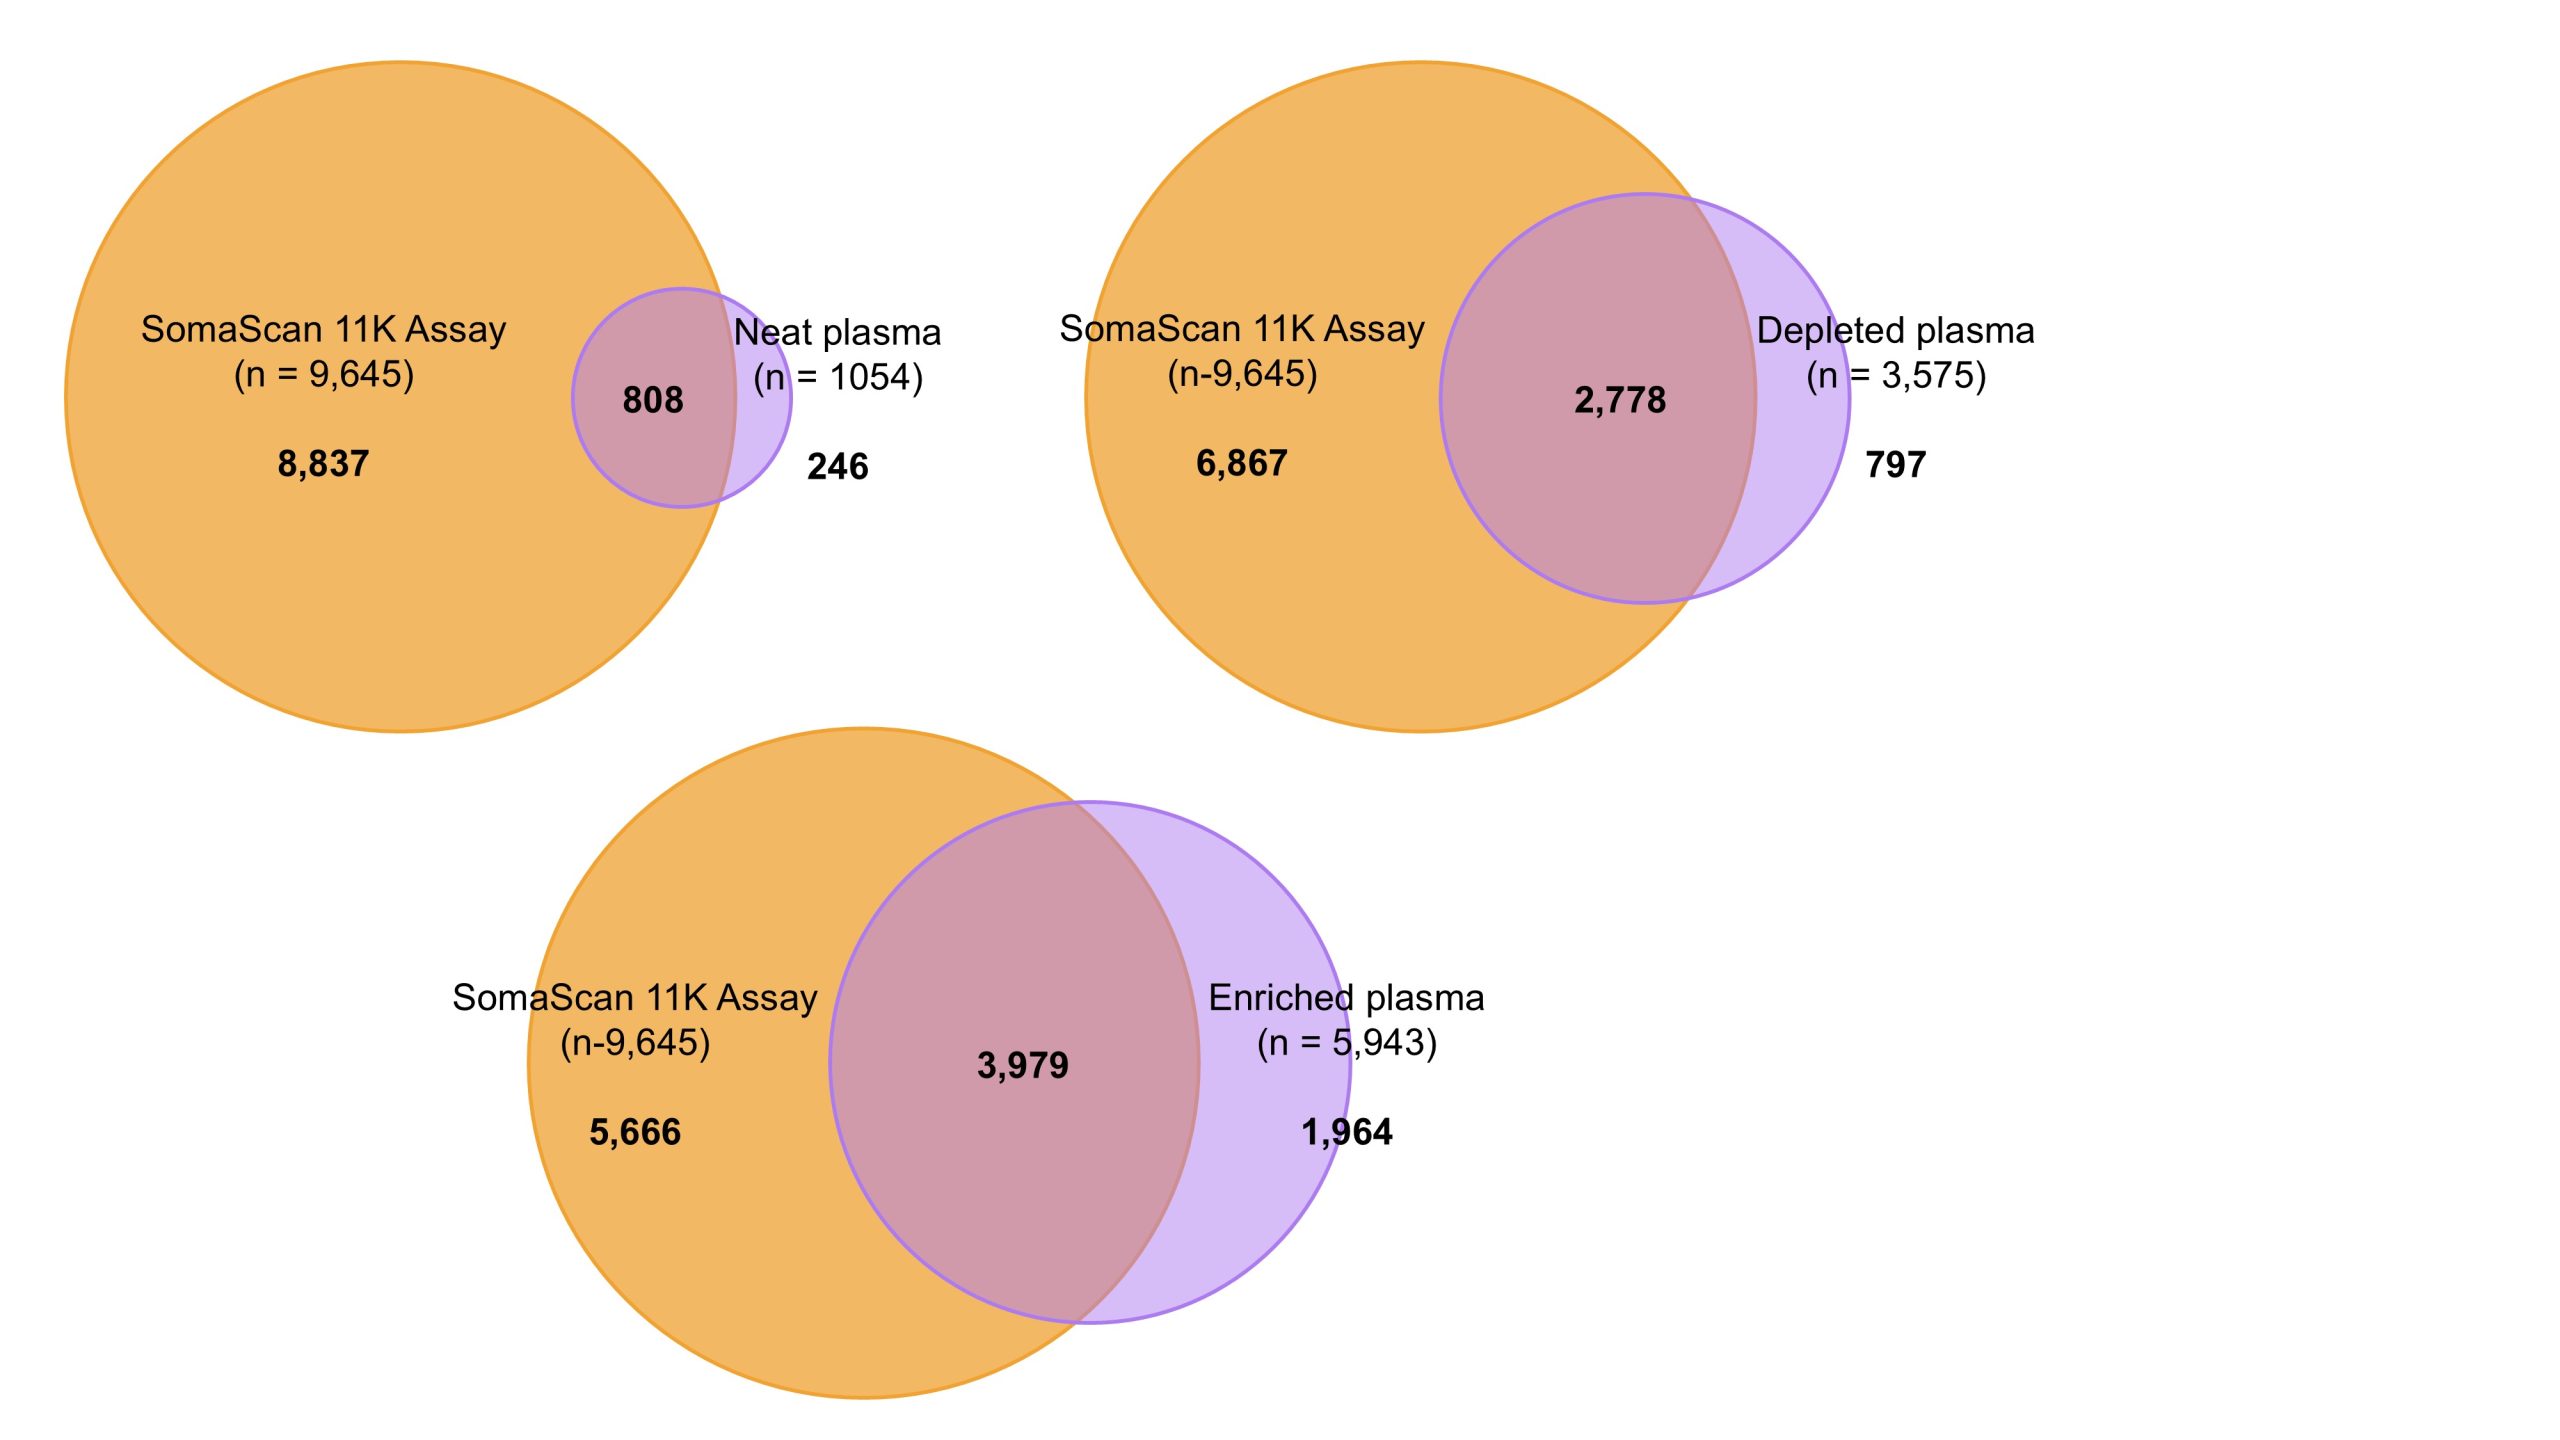
Figure 3. Overlap of proteins measured in plasma by mass spectrometry or affinity-based proteomics. Venn diagrams show the number of unique and overlapping proteins detected using three different mass spectrometry-based workflows (purple): neat plasma, plasma with the top 14 most abundant proteins depleted, and enriched plasma. These are compared to the analysis of neat plasma with the SomaScan 11K Assay (orange), a high-plex affinity-based proteomics platform. Data adapted from Beimers et al. (neat plasma) and Kirsher et al. (depleted plasma, enriched plasma, SomaScan 11K Assay)5,7.
References
- Deutsch, E.W. et al. “Advances and Utility of the Human Plasma Proteome.” Journal of proteome research 20,12 (2021): 5241-5263.
- Rice, S.J. et al. “Characterization of effective, simple, and low-cost precipitation methods for depleting abundant plasma proteins to enhance the depth and breadth of plasma proteomics.” Proteomics 24,15 (2024): e2400071.
- Jaros, J.A.J. et al. “Affinity depletion of plasma and serum for mass spectrometry-based proteome analysis.” Methods in molecular biology (Clifton, N.J.) 1002 (2013): 1-11.
- Bhowmick, P. et al. “An Update on MRMAssayDB: A Comprehensive Resource for Targeted Proteomics Assays in the Community.” Journal of proteome research 20,4 (2021): 2105-2115.
- Deutsch, E.W. et al. “Human Proteome Project Mass Spectrometry Data Interpretation Guidelines 3.0.” Journal of proteome research 18,12 (2019): 4108-4116.
- Beimers, W.F. et al. “Technical Evaluation of Plasma Proteomics Technologies.” Journal of proteome research 24,6 (2025): 3074-3087.
- Roger, K. et al. “Mining the plasma proteome: Evaluation of enrichment methods for depth and reproducibility.” Journal of proteomics 321 (2025): 105519.
- Kirsher, D.Y. et al. “Current landscape of plasma proteomics from technical innovations to biological insights and biomarker discovery.” Communications chemistry 8,1 279. 25 Sep. 2025.

More blogs
BlogAntibodies: The Hidden 20% of the Plasma Proteome
Antibodies make up 20% of plasma yet most proteomics studies overlook their specificity and early disease signals.
BlogHigh-Plex Affinity Proteomics for Plasma
High-plex affinity proteomics enables deep, reproducible plasma biomarker discovery. See how the SomaScan 11K Assay delivers scale, sensitivity, and coverage.
BlogPlasma Proteomics 101: Why It’s Central to Biomarker Discovery
Plasma proteomics is central to biomarker discovery. Understand the plasma proteome, its complexity, and how blood proteins reveal health and disease.